But a more useful way to think about risk is as the chance of permanent loss, whereby taking on more risk increases the chance of loss, while cutting risk reduces the chance.
Of course, there are times when increasing risk makes sense because the potential reward sufficiently outweighs the potential loss. But there are a number of risk factors to consider before making this decision.
When thinking about the shape of risk, it is important to consider sentiment, positioning, and valuation. Sentiment is how investors feel; positioning is what they own; and valuation is what they pay for a unit of earnings.
The best scenario is when the market is negative on an asset which is under-owned but which in fact offers excellent value. This may be stating the obvious, but it provides a good framework to consider the options in the S&P 500.
While we are investors in global equities, we often focus on the position of US financial markets in isolation. We track indices such as the S&P 500, because they remain the largest, the most influential and the home to vast amounts of the world’s savings. When the US sneezes the world still catches a cold, even if that metaphor is more questionable after the pandemic.
Sentiment and positioning
Investor sentiment is currently at odds with positioning. It is as if investors in the US are very pessimistic but doing little about it.
There are many relevant sentiment measures but The American Association of Individual Investors (AAII) supplies two of the most watched with its Bull/Bear Indexes (chart below shows bulls minus bears). The data set is volatile and needs to be treated with care because it is a point in time only. But the stark message is that individual investors are very negative in the current environment.
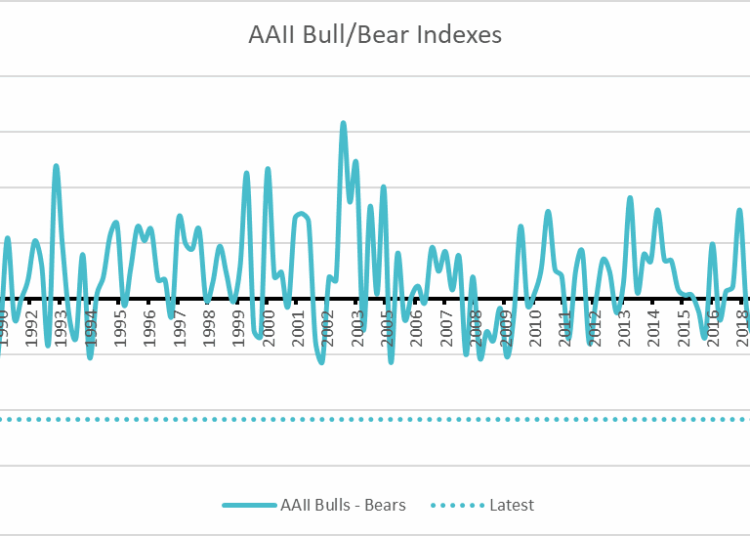
Source: Bloomberg
Interestingly, investors have still rarely been more exposed to share market investment, according to the metrics that we regularly monitor. For example, the percentage of equities to total household and non-profit organisation financial assets is over 35 per cent, not far below multi-decade highs.
Equities feature strongly in investor portfolios
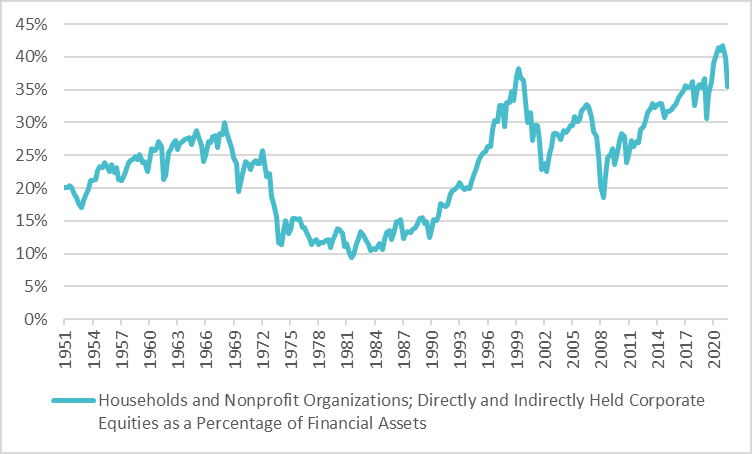
Source: St Louis Federal Reserve
Valuation
There are a number of different measures of market valuation, and combined they provide a good picture of the market.
1. Valuation using ten-year historic earnings
The net effect of this year’s ups and downs is that at the end of the quarter the valuation of the S&P 500 had still only been higher for a total of 9 per cent of the time in more than 140 years of history. This is according to the Shiller Price Earnings Ratio (PE) which measures the price of the index divided by the last 10-years of earnings adjusted for inflation (chart below).
S&P 500 is still expensive
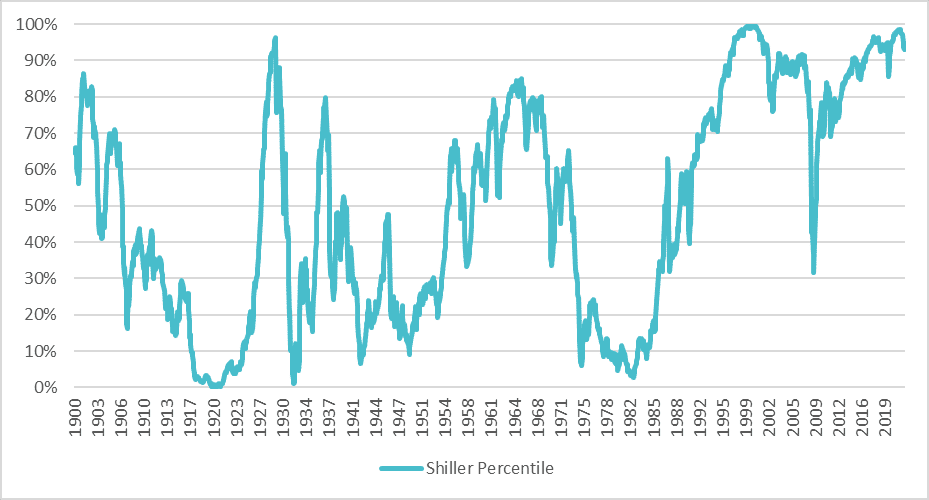
Source: Shiller. Data as of end July 2022
By inflation adjusting, incorporating a full decade of earnings, and smoothing the business cycle, the Shiller PE provides an effective proxy for future cash flows. Another virtue is that it is backward looking, which means that the denominator (that is, the earnings) are objective and set in stone.
2. Valuation using one-year trailing earnings
More commonly used, and more readily understandable valuation measures, use price divided by one year historic – known as trailing – and one year forecast earnings.
The forecasts shown by data providers such as Bloomberg and FactSet are the consensus estimates from analysts at various investment banks, brokers, and boutiques. But our reliance on and curiosity about forward valuations is only passing.
Valuations based on one-year trailing earnings carry a little more weight with us because, as with the ten-year above, they are set in stone. But they still do a bad job of predicting future returns. This is because the numbers are not inflation adjusted and, most importantly, are no more than a snapshot of a certain time within the business cycle rather than representative of earnings through a cycle.
But flawed does not mean uninteresting and, as they are popular metrics, they are worth thinking about.
According to Bloomberg, the S&P 500 PE based on last 12-month earnings is 17.6x, which is superficially a much more comforting position than that suggested by the 27.1x Shiller PE.
But the key word in that sentence is superficially. Firstly, the E is based on lower quality earnings that increasingly diverge from Generally Accepted Accounting Principles. Secondly, the E is also based on corporate profitability that is defying gravity.
Conclusion
Based on our risk framework, we have found that sentiment (how investors feel about the market) is currently at odds with positioning (what they own), and valuation (what they pay for earnings). Neither positioning nor valuation are where they should be if you care about preserving your existing capital, let alone making money. The priority for investors should be to rebalance their portfolios to protect their wealth, so that capital can then work for them when things improve, as they eventually will.
Hugh Selby-Smith, co-chief investment officer, Talaria Capital


