Despite all of the optimism last spring surrounding a strongly rebounding economy and the expectation that this growth would be fully captured by small caps due to their well-known greater cyclical sensitivity than large caps, subsequent performance differed greatly from expectations.
For the 12 months ended 31 March 2022, the small-cap Russell 2000 Index, declined by 5.8 per cent, while the large-cap Russell 1000 Index advanced by 13.3 per cent.
Today, the economic outlook appears both more uncertain and less robust than a year ago. There are some commentators who expect a recession in the next 12 months, where very few had that negative outlook in the spring of 2021. Additionally, while the Federal Reserve was extremely accommodative a year ago, the Fed is currently expected to be starting a rapid rate rising cycle, the trajectory of which we have only experienced a handful of times over the past 40 years. This may seem like exactly the wrong environment to recommend a reallocation from the perceived greater safety and higher relative returns of large caps into the greater economic sensitivity and more disappointing returns of small caps, yet that’s what we recommend. Below, we review the case for why this is a good time to take this apparently risky step.
Our case for greater small-cap returns than large-caps going forward starts with relative valuation. As the chart below shows, small-caps are at their most favorable relative valuation discount to large-caps in more than 20 years.
The Russell 2000 is at its most attractive relative valuation vs. the Russell 1000 in more than 20 years
Russell 2000 vs. Russell 1000 Median LTM EV/EBIT¹ (ex. Negative EBIT Companies)
From 31 March 2002 to 31 March 2022
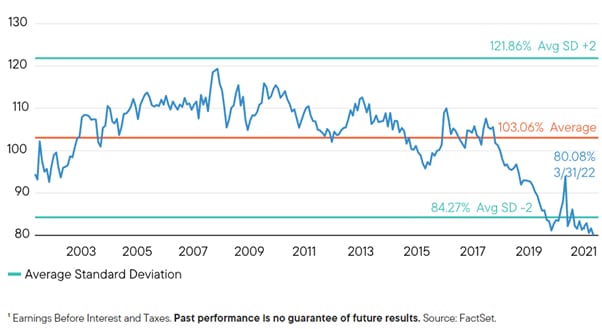
Based on our preferred valuation metric, EV/EBIT (Enterprise value/Earnings Before Interest and Taxes), small caps currently sell at a 20 per cent discount to large caps compared with a 3 per cent premium average valuation over the past 20 years. We think this valuation dispersion is particularly relevant in today’s environment because we anticipate that interest rate increases will have their greatest negative effect on higher valuation stocks while having a more modest effect on lower valuation stocks. Thus, given small cap’s valuation discount to large caps, we see small caps sidestepping most of the valuation compression we anticipate for large caps due to rising rates.
Our next reason to expect small caps’ outperformance over large caps is precisely because small caps’ multi-year underperformance has been so pronounced. There are many examples of reversion to the mean and cycles of out and underperformance in investing. The relationship between small and large cap is no exception to this pattern. Historically, when small caps have underperformed large caps by margins that were comparable to the current experience, the future superior returns of small caps have been impressive.
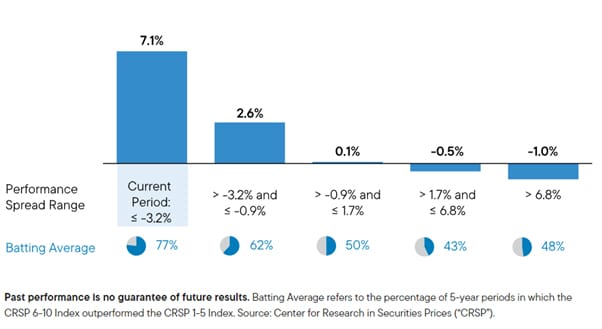
When we want to use longer-term studies (e.g., going back more than 40 years), we utilize the CRSP (Center for Research into Security Pricing) indexes, which extend back nearly a century. And we found that using the post-World War II starting point of 31 December 1945 revealed a robust pattern of meaningful small-cap underperformance in an initial five-year period, reversing to meaningful outperformance over the next five years. For the most recent annualized five-year period ended 31 March 22, the small-cap CRSP 6-10 underperformed the large-cap CRSP 1-5 by 4.9 per cent, which was in the bottom quintile of all five-year periods since the end of 1945. Yet this ostensibly bad news may foreshadow good news for small-cap investors. In subsequent five-year periods, small caps beat large caps 77 per cent of the time by an average of more than 7 per cent.
The long history of small-cap relative performance reversals
Subsequent Average Five-Year CRSP 6-10 Index vs CRSP 1-5 Index Performance Spread Following Five-Year Performance Spread Ranges
From 31 December 1945 to 31 March 2022
Many experienced investors will recall the notable period of small-cap underperformance during the second half of the 1990’s. Small caps ended the decade on 31 December 1999, underperforming large caps by 8.0 per cent before rebounding over the next five years to outperform by 12.4 per cent. While relative returns may not revert to a spread of that magnitude, we think that the probability of a reversal is high in small-caps’ relative results from the current starting point.
Our final reason to expect small caps to resume market leadership is the fundamental small cap investing principle that investors often do best investing in small caps starting in times when fear is higher than average. Because small caps are viewed by many investors as inherently riskier, their valuations bear the brunt when investors’ uncertainty and anxiety surge. One metric that demonstrates this pattern is the VIX index, which is commonly called the “fear gauge.” Having studied the historical relationship between the VIX and subsequent small-cap returns, we have gleaned two important observations. First, as anticipated, subsequent three-year returns for small caps are positively correlated with the monthly average VIX level for the month preceding investment. In other words, when the “fear gauge” is high, subsequent small-cap returns generally have been as well. Conversely, when the fear gauge is low, subsequent small-cap returns have often been more lackluster. Why this relationship is relevant today is that for March, the average daily VIX value exceeded 25 and thus was in its highest bucket, suggesting the possibility of attractive small-cap returns to come.
Subsequent monthly rolling average annualized three-year performance for the Russell 2000 in monthly Rolling CBOE S&P 500 volatility index (VIX) return ranges
From 31 December 1989 to 31 March 2022
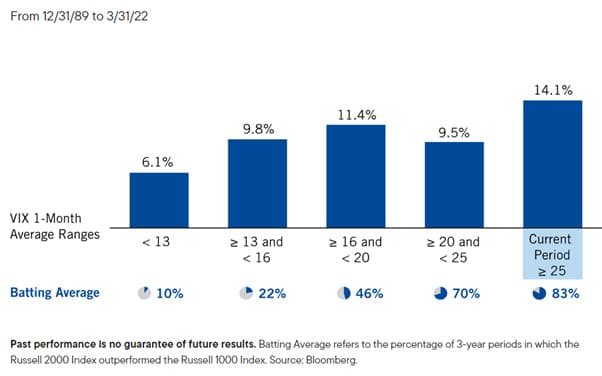
Second, and more relevant to the idea of reallocating away from large caps, is a stronger relationship than small cap’s subsequent absolute returns: small caps’ relative return batting average versus large caps. The higher the level of the average VIX, the higher batting average small cap achieved in subsequent three-year relative performance. During previous periods that began with VIX levels comparable to March 2022’s 25-plus VIX reading, small cap’s subsequent three-year batting average was 83 per cent. In the context of our experience as small-cap investors for nearly 50 years, we think this relationship makes sense—higher investor anxiety seems to compress small-cap valuations more than it does to large caps, while a reduction in fear shows investor sentiment gravitating back to average, which disproportionately benefits those depressed small-cap valuations.
We can certainly appreciate that it has been a difficult 12 months for small-cap investors, particularly in light of both the optimistic expectations many of us had last year and in contrast with the performance of large caps. We are also cognizant of the view that an uncertain economic outlook, heightened geopolitical tensions, and an increasingly restrictive Federal Reserve have created a particularly inhospitable investment environment for small-cap stocks. Despite, or perhaps even because of, those perceptions, we would offer that these potential negatives, at least to us, seem more than fully reflected in small cap’s currently very low relative valuation and historically wide spread of lagging relative results. We are highly aware that rebalancing a portfolio from current areas of strength to current weakness requires a great deal of discipline and fortitude. And still, our view is that the historical record indicates that client portfolios could reap the benefits in the future of a reallocation today from large caps to small caps.
Steve Lipper, senior investment strategist, Royce Investment Partners, part of the Franklin Templeton Group


