X
  • About
  • Advertise
  • Contact
  • Events
Subscribe to our Newsletter
  • News
    • Markets
    • Regulation
    • Super
    • M&A
    • Tech
    • Appointments
  • Podcast
  • Webcasts
  • Video
  • Analysis
  • Promoted Content
No Results
View All Results
  • News
    • Markets
    • Regulation
    • Super
    • M&A
    • Tech
    • Appointments
  • Podcast
  • Webcasts
  • Video
  • Analysis
  • Promoted Content
No Results
View All Results
No Results
View All Results
Home Analysis

Late cycle, long cycle, mid-cycle, unicycle

More often than not we have been asked about one thing: the credit cycle, how long it has gone on, and when it is going to end.

by Justin Bourgette & Jeffrey Mueller
May 28, 2019
in Analysis
Reading Time: 3 mins read
Share on FacebookShare on Twitter

This cycle is certainly long, but that is not to say that the end is imminent. We try to cut through the noise and see what the available data is telling us.

So what are the markets telling us?

Against the backdrop of strong corporate earnings, the fundamental picture remains robust in the U.S. loan and bond markets, with signs of continued strengthening. Q1 2019 saw another decrease in leverage and an increase in interest coverage, both continuing multi-quarter trends of improvement.

Europe has reported solid interest coverage levels (largely driven by lower borrowing costs) but this has been overshadowed by a steady increase in the average leverage of borrowers in this market.

Signs of continued divergence but high-yield fundamentals remain solid

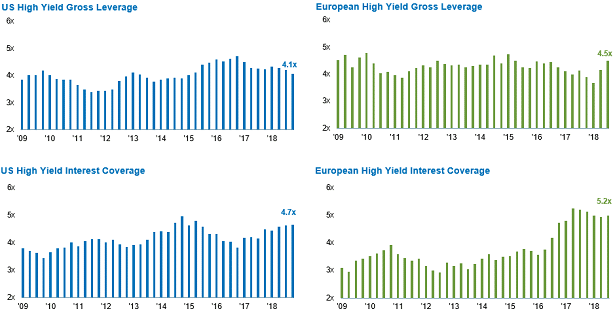
Source: Morgan Stanley. Data as of 31 December 2018.

‘Late-cycle’ behavior is typically characterized by increasing leverage and falling interest coverage as companies take more risk to try and generate returns, and getting themselves into serious difficulty when the cycle turns. Think about technology, media and telecommunications companies in the early-2000s as a prime example.

The current data is not quite painting as negative a picture as the media headlines would have investors believe.

Is any of this information investable?

Despite the slightly weakening fundamental picture, we believe the value opportunity is still compelling. In the chart below, we do some analysis to facilitate a like-for-like comparison of the credit spreads available in the US high-yield corporate bond markets (US-dollar denominated) and the European high-yield corporate bond markets (euro and sterling denominated). The analysis involves stripping out the energy sector from the US, as this is only a small portion of the European benchmark. We also re-weight the indices to have the same average credit rating and duration profile.

Relative value continues to favor European high-yield bonds

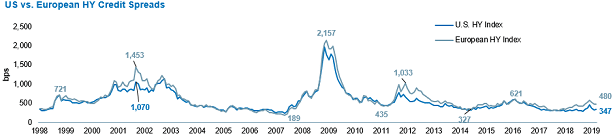
Source: Morgan Stanley. As of 31 March 2019. US and European High Yield Spread data is option-adjusted, ratings-normalized, and excludes energy and commodities. bps = basis point (one hundredth of one percent).

You can see that outside of three instances of extreme market stress (dot-com bubble, global financial crisis and Eurozone sovereign debt crisis), the European markets are trading as wide (from a credit spread perspective) as they ever have to the US markets.

X

We do not believe that this is warranted, and are confident that the fundamental picture remains supportive enough to take a meaningful position in these markets.

We are not saying that we’re early cycle, but we’re also not necessarily saying that the cycle is about to end. Periods of volatility may show themselves across leveraged credit markets, as they did in Q4 2018. But if you focus on the fundamentals and avoiding those defaults, we think you can make money from leveraged credit markets over the long term.

We suggest looking past the noise in the market about “late-cycle” and focusing on what the available data is telling you.

 The two primary things we focus on across our core allocations in leveraged credit are:

1. How many times over a company’s earnings cover the coupons it needs to pay on its outstanding bonds (i.e. interest coverage)

2. The level of debt a company carries on its balance sheet relative to the level of earnings it generates (i.e. leverage)

The first criteria lets us assess a company’s ability to service its debt, and the latter is often a measure of how aggressive a company is.

Justin Bourgette, associate director of customised solutions, Eaton Vance Management and Jeffrey Mueller, high yield portfolio manager, Eaton Vance Advisers International

Related Posts

From greenwashing to greenhushing

by Stephen M Liberatore
December 16, 2025

As some US companies embraced "greenhushing" in 2025, global green bond markets kept expanding, showing the importance of careful credit...

Markets look to end the year with momentum

by Patrick Nicoll
December 8, 2025

After a year dominated by political noise, inflation surprises and shifting central bank signals, global markets are closing out 2025...

From artificial to sustainable intelligence: The global energy challenge

by Velika Talyarkhan
December 1, 2025

The promise of AI can only be realised if the world learns to expand this technology without exceeding the limits...

Leave a Reply Cancel reply

Your email address will not be published. Required fields are marked *

VIEW ALL
Promoted Content

Why U.S. middle market private credit is a powerful income solution for Australian institutional investors

In today’s investment landscape, middle market direct lending, a key segment of private credit, has emerged as an attractive option...

by Tim Warrick
December 2, 2025
Promoted Content

Is Your SMSF Missing Out on the Crypto Boom?

Digital assets are the fastest-growing investment in SMSFs. Swyftx's expert team helps you securely and compliantly add crypto to your...

by Swyftx
December 2, 2025
Promoted Content

Global dividends reach US$519 billion, what’s behind the rise?

Global dividends surged to a record US$518.7 billion in Q3 2025, up 6.2% year-on-year, with financials leading the way. The...

by Capital Group
November 18, 2025
Promoted Content

Why smaller can be smarter in private credit

Over the past 15 years, middle market direct lending has grown into one of the most dynamic areas of alternative...

by Tim Warrick, Managing Director of Principal Alternative Credit, Principal Asset Management
November 14, 2025

Join our newsletter

View our privacy policy, collection notice and terms and conditions to understand how we use your personal information.

Latest Podcast

Podcast

Relative Return Insider: MYEFO, US data and a 2025 wrap up

by Staff Writer
December 18, 2025
After more than two decades, InvestorDaily continues to be an institution that connects and influences Australia’s financial services sector. This influential and integrated media brand connects with leading financial services professionals within superannuation, funds management, financial planning and intermediary distribution through a range of channels, including digital, social, research, broadcast, webcast and events.

Subscribe to our newsletter

View our privacy policy, collection notice and terms and conditions to understand how we use your personal information.

About Us

  • About
  • Advertise
  • Contact
  • Terms & Conditions
  • Privacy Collection Notice
  • Privacy Policy

Popular Topics

  • Markets
  • Appointments
  • Regulation
  • Super
  • Mergers & Acquisitions
  • Tech
  • Promoted Content
  • Analysis

© 2025 All Rights Reserved. All content published on this site is the property of Prime Creative Media. Unauthorised reproduction is prohibited

No Results
View All Results
NEWSLETTER
  • News
  • Markets
  • Regulation
  • Super
  • M&A
  • Tech
  • Appointments
  • Podcast
  • Webcasts
  • Promoted Content
  • Events
  • About
  • Advertise
  • Contact Us

© 2025 All Rights Reserved. All content published on this site is the property of Prime Creative Media. Unauthorised reproduction is prohibited