There are many ways to define an inverted yield curve, but the one we prefer occurs when an investor can earn more by buying a 2-year US Treasury (UST) note than a 10-year one. This economic gauge has recently received wide attention because an inverted yield curve has occurred prior to each of the last five US recessions.
On the surface, history suggests that investors should take caution given these developments, but the performance of corporate bonds suggests that they could be an effective way to navigate these volatile times.
Why does the yield curve invert?
Equity-market corrections haven’t had a great history of predicting recessions, but inversions in the bond yield curve have been more reliable. In fact, every yield curve inversion since 1977 has been followed by a period of economic contraction as measured by gross domestic product (GDP).
While there is typically a delay between when the yield curve inverts and the first negative GDP report, each cycle is unique, with the time lag ranging anywhere from seven to 10 quarters. Since 1984, when the curve has inverted, the most that a 10-year UST has under-yielded a two-year UST was 55 basis points (bp); during the 2008 credit crisis, this difference was only 19 bp.
A flattening of the yield curve has been strongly correlated with the Federal Reserve (Fed) raising its targeted overnight lending rate, which pushes up the yields on short-term bonds, while having less of an influence on longer maturities. This implies that tighter monetary policy tends to produce a curve flattening, and when sustained, often leads to inversion. What causes long rates to respond differently to Fed rate increases than the front part of the curve? An inverted yield curve may be a reflection of investors’ concern about future economic activity, and a preference to lock in longer-term rates.
Currently, an investor could earn only an incremental 0.15 of a percentage point in yield by extending maturity from a 2-year UST note to a 10-year note. Prior to the Fed embarking on its most recent series of rate increases, this yield pickup was over 1.0 per cent, about equal to its long-term average since 1978. A curve flattening to below +15 bp has resulted in a yield-curve inversion and a recession in every instance but one. The one time it didn’t was in 1994, when the Fed reversed course the following year and loosened monetary policy.
How is the slope of the yield curve related to economic activity?
Historical data indicates that recessions tend to follow yield-curve inversions, but why is this the case? One explanation is that inverted yield curves detract from the profitability of banks, since these financial institutions borrow short and lend long.
During periods when banks have to offer more competitive short-term rates to attract deposits, their profit margins usually suffer. This causes banks to tighten lending standards, which in turn reduces consumers’ access to capital. The recent rise in bank advertisements boasting high introductory rates on new savings accounts may be ushering in such a period.
Aside from the yield curve, there are other signs that this economic cycle – one of the longest on record – is in the latter stages: slowing global economic activity, soft earnings growth and historically high corporate leverage.
History suggests that the initial inversion of the yield curve is an early warning sign of a recession. But we can’t be certain one will occur, or when. As mentioned earlier, tighter monetary policy plays a role in flattening the yield curve, and the Fed is currently seen as pausing on hikes, with market expectations of a 2019 hike falling to less than 2 per cent from over 90 per cent a few months back, according to Bloomberg.
With economic growth slowing and core inflation running at about their 2.0 per cent target, we believe Fed officials will not be under pressure to normalize rates or further unwind the balance sheet. Furthermore, banks’ net interest margin remain healthy overall, an encouraging sign that a recession may still be far off.
Has the yield curve for investment grade corporate bonds ever inverted?
The yield curve for investment grade (IG) corporate bonds has never inverted. In fact, 10-year IG bonds on average currently out-yield two-year bonds by about 1.0 per cent, more than double the level the last time the UST curve was this flat.
The four Fed rate increases in 2018 helped push the yield on intermediate IG corporate bonds to 3.5 per cent, their highest level since 2011. While higher UST yields and rising credit concerns caused other fixed-income markets to post material losses last year, intermediate IG corporate bonds registered a decline of just 0.17 per cent for all of 2018, attesting to the high quality of the asset class.
Yield of IG corp bonds (blue) and the Treasury yield curve (red).
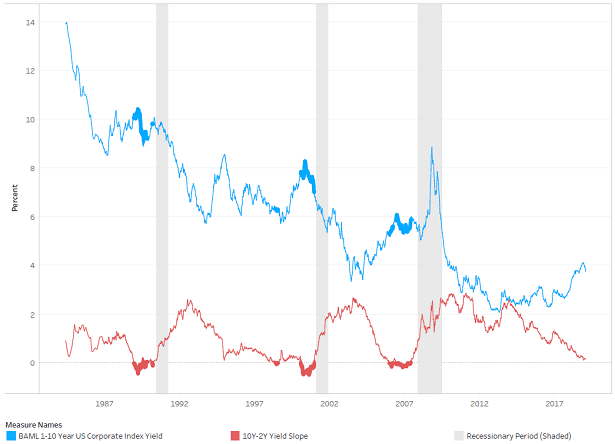
As the thicker, shaded areas in the red and blue lines in the chart above indicate, when the UST curve has inverted, intermediate IG yields initially rose as spreads widened due to concerns that an ensuing recession will cause a jump in credit issues. But this effect is then typically followed by a decline in corporate yields, led lower by cuts in the federal funds rate and a steepening of the UST curve.
The yield curve is very flat right now but has yet to invert, an event typically associated with a recession. Given the dependence of the curve on future Fed activity as well as the variability in historical timeframes between inversion and recession, we think it makes sense for investors to be cautious and consider allocating to intermediate IG corporate bonds as a way to generate income and potentially protect against downside risk.
Thomas H. Luster, director, quantitative strategies, diversified fixed income at Eaton Vance and Bernard Scozzafava, director, diversified fixed income quantitative research, Eaton Vance


