- US dollar cash is once again a viable asset class, while structured products that require dollar leverage, particularly offshore, are looking highly vulnerable.
- The fact that the US equity market appears to be relatively immune from the global concerns about slower growth and trade wars raises comparisons with Japan in the late 1980s when, as a global supplier of liquidity, it brought its cash home, creating an unsustainable bubble.
- The midterms may provide some relief on trade war disputes but the ongoing new economic cold war between the US and China looks set to be a feature of the investment landscape for the foreseeable future. Diversification between both sides, plus Europe looks a sensible tri-polar strategy from now on.
Last week, the MSCI world equities index dropped almost 5 per cent, erasing the last six months of gains and – importantly from a technical point of view – taking out the long-term moving average, likely triggering a lot of protection selling around the 2130 level. The selloff was probably linked to attempts to drive the S&P500, NASDAQ and Nikkei back below their long-term moving averages as these were the last remaining markets that were holding a bull market pattern. As it stands all three bounced on this long term support, which is encouraging in the short-term, at least. Here in Asia, the Hang Seng and MSCI China index remain below their long term averages – as indeed they have been since the asset allocators began to switch out mid-year as part of a general rotation out of emerging markets.
However, the bigger story of the last few weeks to my mind has been the decisive break above 3 per cent on the US ten-year bond, which had been in a bear market (defined here by me as with the yield trading above its long-term moving average) all year, as have both high-yield and investment grade bonds. At the beginning of September, the ten-year yield broke above its short and medium term moving averages and spiked almost 10 per cent, triggering a sharp rise in volatility. As we know from many previous occasions, such a pebble thrown into the pool of bond liquidity tends to create further ripples through leverage and liquidity effects, as well as the rules-based behaviours of certain structured products such as risk parity funds. When, for example, correlations between bond and equities change – the correlation between US long bonds and the S&P 500 went from -0.4 at the end of August to -0.06 by last week, while volatility doubled – VIX went from 12 to 24 over the last week and as noted, bond volatility also jumped volatility doubled – om -0.4 at the end o, triggering a sharp rise in risk parity funds will cut equities (where most of their volatility risk is usually concentrated) but with bond volatility also jumping, they would likely reduce leverage and move more into cash.
This is now an important consideration for investors. US cash has been one of the best performing assets in 2018 and now represents a genuine alternative asset class. A near zero duration, AAA rated, low volatility asset that yields 2.4 per cent and has zero downside. What is not to like? With cash, 2 year, 5 year and 10 year bonds all now yielding their highest since the financial crisis, spreads on other assets such as cap rates on property are hitting decade lows. Equally, spreads between corporate bonds rated BAA and US 10 year have picked up from a little over 1.5 per cent points in March (lows not seen since 2006) to a healthier 1.9 per cent points, pushing corporate bond yields back above 5 per cent.
As well as being an interesting alternative asset class and a threat to high fee-based alternatives – you need to return almost 4 per cent on a 1 and 10 per cent fee structure to beat cash now – the rising cost of labor represents a problem for those using cash as a raw material for financial products. Principally this means assorted leveraged strategies and carry trades are becoming increasingly challenged, but it also causes problems for those dependent on cheap offshore dollars. We have discussed this on numerous occasions in the past, but the ability and willingness of some of the world’s largest investors, Japanese and European insurance companies, to hold US Treasuries reflects their ability to hedge currency. At the moment, the cost of hedging offshore dollars exceeds the nominal return such that to a Yen or Euro investor the return is actually negative. This is almost certainly behind the recent break out in the US ten-year yield. On the positive side, a rise in corporate bond yields helps with a number of pension schemes to lower their deficits as they use the corporate bond yield as a discount rate for their liabilities, so the end of one positive aspect of quantitative easing may also signal the end of a negative one.
As usual, however, these market gyrations are being blamed on politics and particularly the US/China trade dispute, which has morphed from a “trade war” to an economic cold war, when it is really all about forced selling, distressed selling and simple capitulation – the latter is also distorted by ETFs which sell indiscriminately. Indeed, I continue to believe that the scarcity of offshore US dollar liquidity is a major factor driving markets at the moment. As one of the panellists opined at a recent Barclays event I attended in Singapore, if you had been told at the beginning of the year that China and America would be locked in a serious trade spat and an economic Cold War, you would have expected both markets to be off by 20 per cent by now. Well China is, but the US isn’t and I believe that has much to do with liquidity. In many senses, the US is starting to take on the characteristics of late 1980s Japan, which shrugged off the 1987 crash and in repatriating a lot of liquidity drove the Nikkei to highs it hasn’t seen since. Consider Chart 1, which shows how the S&P500 has outperformed the Shanghai Composite by almost 50 per cent over the last year in an environment which, all else being equal, should impact both economies.
Chart 1. Lessons from history. US v China
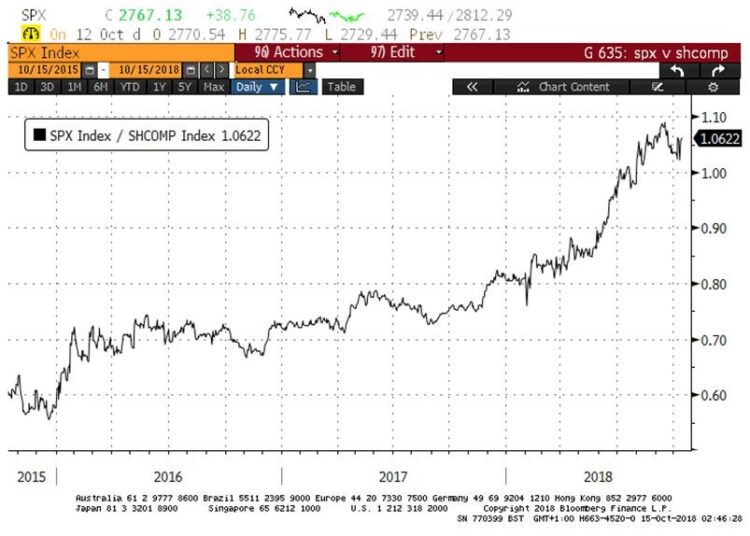
Source. Bloomberg, Axa-IM October 2018
This reminds me of the period over 30 years ago when after the 1987 crash – largely a function of portfolio insurance triggering the type of forced selling that we have seen this year in Emerging Markets – the Japanese equity market then outperformed the US by around 70 per cent. At this time the valuations in Japan were such that Nomura was said to have enough cash on its ‘fortress balance sheet’ to buy every bank on Wall Street and the land around the Imperial Palace was valued at a level higher than the whole of California. At the time we recognized these to be foolish and yet few truly believed that the forces of economic gravity would re-assert themselves, as shown in Chart 2, when all that outperformance was given back.
Chart 2: The forces of Economic and Market Gravity
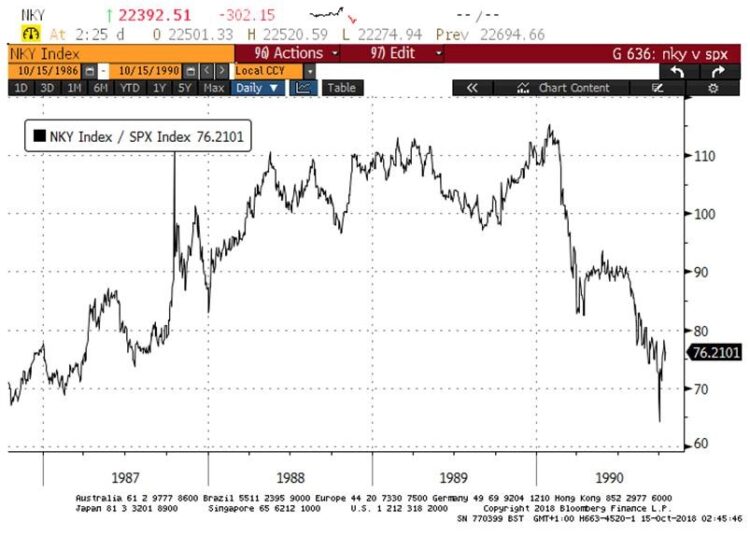
Source. Bloomberg, Axa-IM October 2018
As discussed on numerous occasions, the outperformance of the Japanese markets was exaggerated at the time by the foolish notion of risk management that determined that as Japan was almost 50 per cent of the benchmark, the best way to reduce your risk was to put 50 per cent of your money in Japan and obviously also to put the most into the biggest companies. Following a similar failure with market cap indexation at the dot com boom a decade later, investors finally gave up on the notion of benchmark risk – leading to the smart Beta revolution – although unfortunately they have been equally enthusiastic in replacing benchmark risk with volatility risk. That led to the low volatility CDS debacle a decade ago and we have to hope that continued obsession with low volatility as low risk won’t give us another financial crisis. As well as a strong capital inflow dynamic, other similarities between the US now and Japan 30 years ago include corporates being the biggest buyers of equities – then it was Zaitech, cross shareholdings, now it is share buybacks – concentration of index performance in a few mega cap names and a general belief that a high stock market was somehow a confirmation of the wonders of the economy and its stewards. Plus ça change (as they say back in Paris).
Of course while Japan was dominating global markets, Henry Kravis and George Roberts were the Barbarians at the Gate with their audacious Leveraged buyout of RJR Nabisco and thirty years on, part of the reason for the current level of share buybacks is the perceived threat from Private Equity. Moreover, the impact on market liquidity of over $1t trillion of institutional cash flow sitting as dry powder with those Private Equity firms is something that continues to worry me, particularly as many of the same private equity vehicles are behind a lot of potential supply of new IPOs. Biggest among these, of course, is likely to be the proposed IPO of Uber, where Morgan Stanley and Goldman Sachs are proposing a valuation of a staggering $120 billion. This is almost twice the level achieved back in April when Toyota invested $500 million in the firm at a valuation of $72 billion and against a background of losses of $4.5 billion last year on $7.5 billion of sales. However, it is not so much the fact that they are trying to have an IPO of a company with no cash flow that bothers me as what it signals about the whole Venture Capital/Private Equity/Private Credit edifice and its belief that it can liquefy itself via the listed stock markets.
As of last year Uber had raised, and spent, about $11.5 billion, so if we add in the $500 million from Toyota we can estimate that capital has gone in to the tune of $12 billion. Now, according to the bankers, the company is worth ten times that amount, for no other reason than – the bankers say so. Of course, what it means is that the plan is to probably list 20 per cent of the company, enabling all the private credit guys to get out – or more likely have some equity investors to backstop their 8 per cent yields – and all the VC of the company, enabling all the private credit guys to e of their money out, but to be left with a free option on any upside. The upside of course will depend mostly on prospects for autonomous vehicles, which is still, frankly at the VC stage. The listed markets, meanwhile, get to invest in a disruptor, but a disruptor in an industry that has already been disrupted and where, clearly, the barrier to entry has been lowered significantly. Interesting to look at the share price performance of one of the ted and to Uber over the last 5 years, Medallion Financial, which essentially finances and trades the licensed taxi medallions whose fantastically profitable business was disrupted by Uber. Between end 2013 and last year, Medallion Financial lost almost 90 per cent of its value relative to the S&P 500 and clearly while Uber took the sales, the real beneficiaries were the consumers. This is in fact largely true of most disruptive industries: think of the internet, the benefits from removing barriers to entry (in this case a restricted, license or medallion) go to the consumer more than the disruptor.
Chart 3: Uber disrupted the Taxi Medallion business
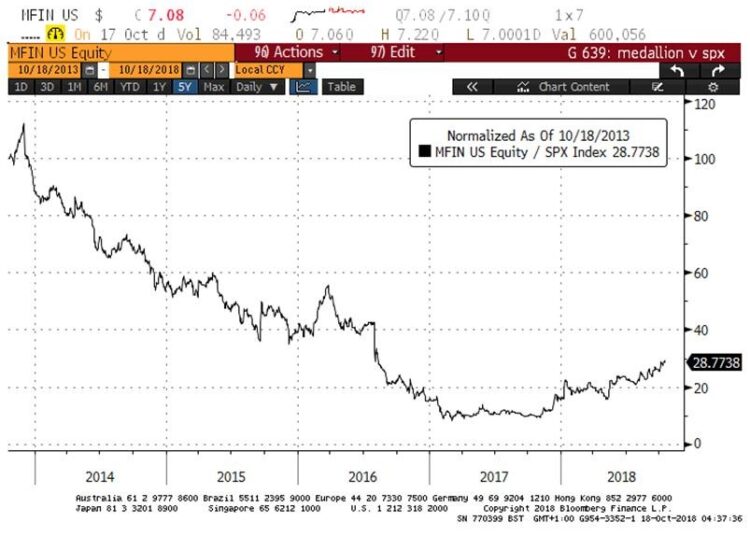
Source: Bloomberg, Axa-IM October 2018
We know that, rather like Nomura in 1989 having enough cash to buy most Wall Street Banks, the big US tech companies have enough cash to buy the rest of the US small and mid-cap market. Moreover with a lot of that cash pile deployed in corporate bonds, in many senses they are indulging in a version of Zaitech, just like Japanese corporations. Might then an Uber IPO valuing a loss making low barrier to entry taxi business at something similar to the combined market caps of BMW and Volkswagen be the equivalent of the Imperial Palace in 1989? Should we perhaps take notice of what Tech investor Chamath Palihapitiya who runs Social Capital, a Silicon Valley tech investment firm, said about VCs and the start-up economy last week? To quote, he said “We are, make no mistake.”
Currently the US is over 40 per cent of global market cap, but almost certainly does not represent 40 per cent of global opportunities in equities. At some point, we believe that investors will rebalance back to non-US equities, but given the geo-political dynamics, we wonder if it is more likely and indeed suitable to split the world into three zones – dollar, euro and RMB. While existing investors may be constrained by the old format of US, (non-US) developed markets and emerging markets, a three pole approach makes a lot of sense to the growing savings base in Asia for example.
This is not to ignore the important issues around the deterioration in relationships between the US and China. To some extent, I continue to believe that this is political and that the Trump administration is looking for some ‘wins’ ahead of the upcoming mid-term elections, but equally I maintain the view expressed over the last six months or so that this is not about trade so much as the fourth industrial revolution and a desire in some quarters to ‘contain’ the rise of China. Thus, while the Chinese may make some concessions on opening up market access to the US and agreeing behaviours around Intellectual Property, the notion that they should somehow suspend the Made in China 2025 policy (as some in the US are demanding) is non-negotiable. There is also the question of the extent to which this proverbial ship has already sailed. To take just one example, while the US currently has 124 super-computers, China has 206 and while the US has just taken back the ‘crown’ for the world’s fastest, the gap between the two countries is now the largest ever. As the chart shows, this has been a dramatic evolution over the last 15 years.
Chart 4: Share of world’s fastest 500 supercomputers, China v US
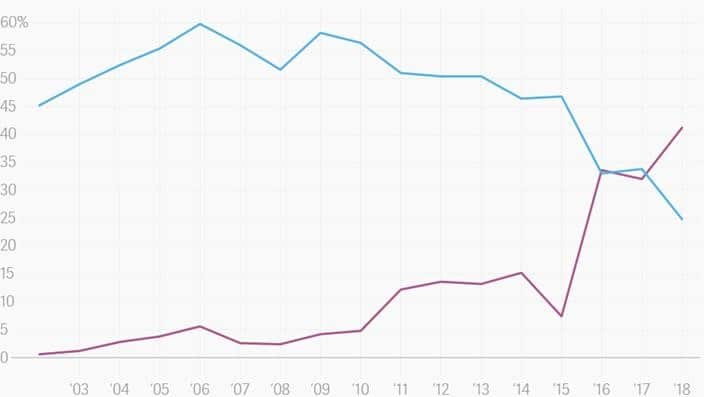
Source: Top500.org
This is of course just one of many such comparisons, China leads by a huge margin in areas such as high speed rail and also many aspects of machine learning. Here, the size of the database is important which gives China a significant advantage in areas such as facial recognition and in AI there is in fact little in the way of intellectual property, as most of the research is open source, so this is not an impediment to growth either. Some in the US seem convinced that the negatives from a trade war are asymmetric between the US and China and also that the relative stock market performance somehow confirms this, even if none of the hard data does. Thus, my other favourite graphic at the moment is the one comparing the GDP of various Chinese cities to countries – an important point I think when running through the standard laundry list of GDP forecasts as a way of assessing potential profitability.
I am addressing an international conference here in Hong Kong in a couple of weeks’ time and thought this was a great way to highlight the significance of ongoing growth in China. Commentators are forever dwelling on whether aggregate Chinese GDP is growing at 6.7 per cent or 6.3 per cent (always presented as a dramatic slowing) and yet the reality is probably that half the country is growing at double digits while half is barely growing at all. What we do know – as do the US companies desperate to gain access – is that while the Chinese population may be aging, China has 400 million Millennials and their spending (and savings) patterns are going to dominate many of the stocks we are investing in for the next decade.
Chart 5: If Cities in China were countries, based on their GDP
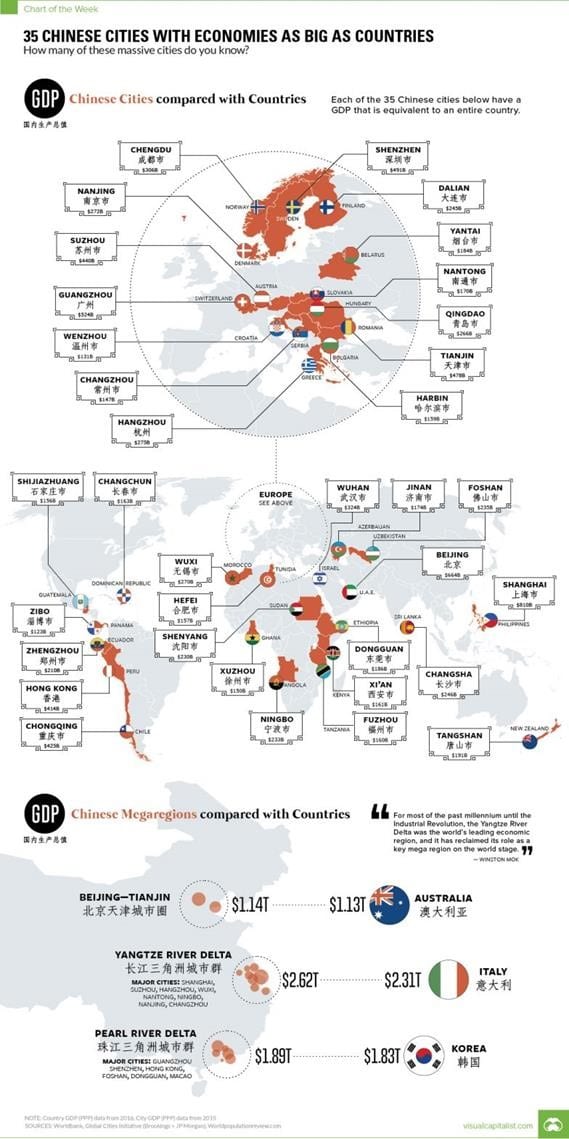
Source Visual Capitalist.com
To Conclude: The listed equity markets are currently struggling with numerous headwinds, from asset allocation out of emerging markets to a notable tightening of offshore dollar liquidity triggering forced selling across various asset classes. The latter, in particular, has pushed benchmark US bond yields higher, which together with a meaningful cost/return on US dollar cash is finally starting to impact on a lot of the winners of the decade of QE.
The US mid-terms, trade wars becoming economic cold wars, the end game of Brexit plus assorted geo-politics (including this week, Saudi Arabia) are all driving the short-term noise, but the longer term strategic shift seems to me at least to be a move away from a unipolar world to a multi-polar one. With the US having outperformed so heavily this year, relative valuations between US dollar, euro and RMB zone assets look distorted suggesting diversification, while the excesses of the private and illiquid markets, particularly in the US, but also elsewhere, have a very late cycle feel about them.
Mark Tinker, Head of Framlington Equities Asia


