The problem is that financial advisers focus too much on annual returns. If clients were to understand they could end up with tens of thousands of dollars more per year in their retirement if they put up with a bit of risk in the short-term, they may consider it an acceptable trade-off.
The typical client has retirement goals that span decades, which means it’s important to take into account an individual’s unique circumstances and long-term goals in order to determine the best investment strategy.
Financial goals for retirement tend to be around having a retirement income that will give us the lifestyle we want, up to a reasonable age (90, for example); and leaving an inheritance for our children.
Financial advisers typically use a questionnaire to assess a client’s tolerance for risk when putting together a financial plan, but the problem is that the questions put too much emphasis on variability in annual returns.
This isn’t necessarily relevant when clients have retirement goals spanning decades.
If an adviser wants to find an appropriate investment strategy that best achieves the client’s goals within their risk tolerance, they have to assess the client’s tolerance for variability in short-term returns (let’s call this ‘short-term risk’, even though it is not actually a risk unless the client has short-term goals).
Consider the plot below:
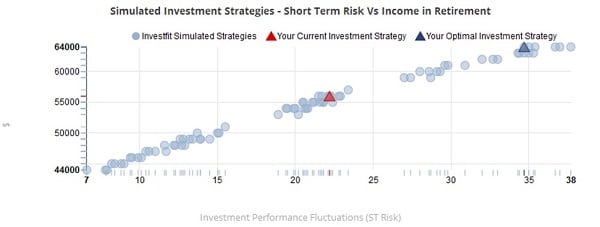
Each dot on this scatter plot corresponds to an investment strategy. The vertical axis shows the retirement income that the investment strategy would produce and the horizontal axis shows ‘short-term risk’.
In this case the worst annual investment return they might expect from the investment strategy (a value of 20 means a “worst case” annual return of -20 per cent).
Importantly, the retirement income shown for each investment strategy has 90 per cent certainty*, meaning, there is only a 10 per cent risk of falling short of this retirement income. The question for the client then becomes:
“You could have $64,000 per year in retirement with 90 per cent certainty* (top right of the chart), but you will likely experience some large negative investment returns on the way (e.g., a loss of 35 per cent in one year). Alternatively, you can have $44,000 per year in retirement with the same 90 per cent certainty* (bottom left of the chart) but experience a smoother ride. Which would you prefer?”
By presenting the information this way, the client is able to understand how much retirement income they give up in exchange for more stable short-term investment returns.
This enables the client to choose an investment strategy that will focus on their most important goals, in consideration of certainty levels and the trade-off between outcomes and ‘short-term risk’.
Currently, investment strategies are based purely on how uncomfortable the client feels when markets go down, but this is potentially shaving long-term results by tens of thousands of dollars.
A client’s discomfort due to short-term variability is important too, and that is why it is included in the above plot (as the horizontal axis), but more information is required to make the best decision.
The main failings of the existing approach to risk profiling is that it does not provide the information necessary to choose the best investment strategy, and it reinforces short-termism when planning for retirement is a long-term project.
Of course, some clients may want to use a different certainty level. We find that people near or in retirement tend to want to plan with more certainty – up to 95 per cent – whereas those still a long way from retirement are happy to plan with a lower level of certainty (around 75 per cent, and in some cases 50 per cent).
Most planning tools show retirement outcomes with only 50 per cent certainty, although this is not usually stated in any advice.
Investfit has prioritised giving financial advisers the option to choose both the certainty level for retirement income, and also the maximum acceptable level of short-term risk.
Equipping them to find the investment strategy that produces the best retirement for the client.
James Claridge is the director of Investfit.
*Certainty levels are based on models that simulate the future, using assumptions based on historic investment returns. All models of the future are necessarily subject to various sources of uncertainty themselves and results from these models should be understood in that context. To re-phrase Donald Rumsfield “there is uncertainty in the estimate of certainty”.


