In recent years investment allocators have voiced a desire to gain exposure to the growing purchasing power of emerging markets (EM) consumers.
That desire is often coupled with the belief that the standard MSCI Emerging Markets Index composition and the strategies benchmarked to it offer less desirable exposures, particularly those related to commodities (oil), financials and state-owned enterprises.
Another concern is whether standard EM strategies continue to deliver the diversification from developed markets strategies that they have historically provided.
In response to these concerns, we highlight the characteristics of EM small cap strategies and their potential benefits.
How does correlation with developed markets compare?
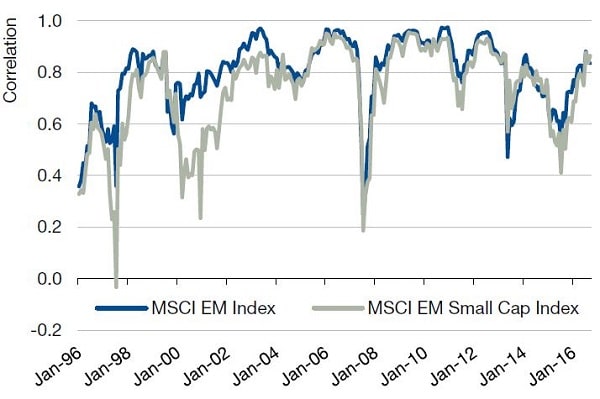
Using monthly US dollar returns, we calculated rolling 12-month correlations between the two MSCI EM indices (standard and small cap) and the MSCI World Index, a proxy for developed markets.
As shown in Figure 1, the MSCI Emerging Markets Small Cap Index (‘MSCI EM SC Index’) remains slightly less correlated with the MSCI World Index but the difference has narrowed in recent years, particularly when compared to the 1990s and early 2000s.
The rise of globalisation, cross border trade and investment, and integration of economic markets has led to the increased correlation of both EM indices to the MSCI World Index over the past 20 years.
Although average correlations are comparable, there have been periods in recent years in which the MSCI EM SC Index has noticeably offered increased diversification benefits.
The most recent example occurred during the mid-2015 period when the China A-share market volatility peaked.
Figure 1. Rolling 12-Month Correlation of EM Indices with the MSCI World Index (Jan. 1996 – Aug. 2016)
What differentiates small cap?
Beyond return correlations, are there other attributes that offer differentiation opportunities going forward? EM small cap companies are more domestic economy-oriented than larger EM companies.
These on average, smaller companies are better positioned to capitalise on the growing demand of EM consumers.
By the nature of their size, larger EM companies generate more revenue abroad than their small cap counterparts, making them less resilient to shocks abroad and more correlated, on average, with developed markets, as previously shown in Figure 1.
As of 31 July 2016, companies in the MSCI EM Index (30.2 per cent) reported a higher percentage of foreign sales than did companies in the MSCI EM SC Index (24.9 per cent).
A significant amount of MSCI EM SC Index companies reported no foreign sales at all, meaning 100 per cent of sales were domestic.
In addition, the MSCI EM SC Index has larger weights in consumer-oriented sectors such as consumer discretionary and health care, and less weight in global demand sectors such as energy and information technology; it also has less weight in the often government supported sectors such as financials and telecommunication services.
By their nature, state owned enterprises (SOE) are often in industries of strategic importance and tend to have larger market capitalisations, making them a more substantial component of the MSCI EM Index than the MSCI EM SC Index.
The sectors most represented by SOE companies are public good sectors such as financials, energy and telecommunication services, with significant country representation in China, Russia, Brazil and India.
Many investors are rightfully wary of companies partially controlled by government interests because state actors could potentially cloud market incentives and create inefficiencies.
As such, SOEs on average are valued at a discount to similar companies without government ownership influence.
What about performance differences?
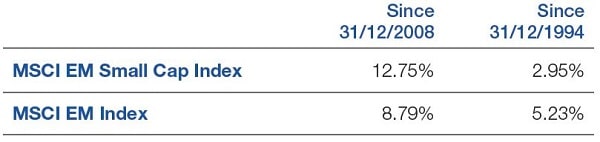
The MSCI EM Index has outperformed the MSCI EM SC Index on an annualised basis since 1994 (Figure 2).
However, more recently, the MSCI EM SC Index outperformed the MSCI EM Index by nearly 4 per cent annually, despite the recent underperformance year-to-date 2016.
Figure 2. Annualised Return through 31 July, 2016
The difference in relative performance over the two periods can largely be attributed to outperformance by the MSCI EM Index between 2003 and 2007.
We believe this performance is attributable to the phenomenal growth generated by China’s industrialisation and associated insatiable demand for commodity resources; this largely benefited larger cap companies supplying China’s demand.
While the initial benefit was concentrated among China’s resource supply chain, over time the benefit led to improved living standards and the development of an emerging markets middle class with associated demands.
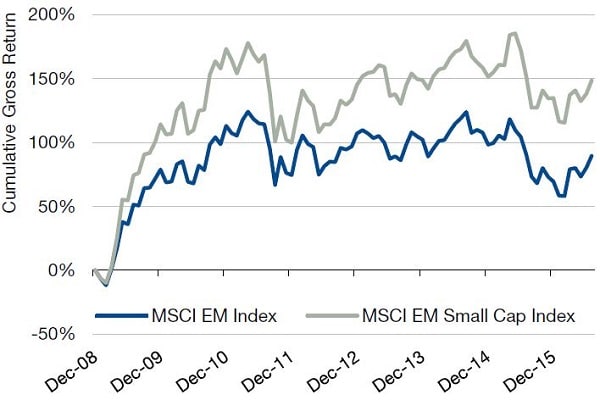
China’s long process of transitioning to more domestic demand-oriented growth drivers has hampered the returns of the MSCI EM Index companies.
As a result, the MSCI EM SC Index has outperformed the standard index, benefiting from growing domestic demand within EM countries (Figure 3).
Figure 3. Cumulative Gross Return (Jan 2009 – July 2016)
We started by comparing the valuations of the MSCI EM SC Index and the MSCI EM Index based on their respective price to book (P/B) and price to earnings (P/E) ratios.
Since 2006 the P/B ratio of the MSCI EM SC Index has been consistently lower (cheaper), but the spread has narrowed in recent years.
The current difference in P/B relative valuation is likely attributable to sector exposure differences and less an indication of investors valuing companies differently in the two indices.
Since 2010 the P/E ratio of the MSCI EM SC Index has been similar to that of the MSCI EM Index. It appears that investors value a unit of earnings similarly within the two indices.
Since investors value the two indices at similar P/E and P/B valuations, the next question is whether relative earnings growth expectations can provide an indication of future relative performance.
On average, the market pays a higher multiple for growth so there is potentially some upside to the EM small cap relative valuation.
We calculated expected (EPS) growth for both indices using IBES estimate data and MSCI benchmark weights as of June 30 2016. Analysis shows that 15 per cent year over year growth is forecasted for the MSCI EM SC Index while -18 per cent year over year growth is forecast for the standard index.
With similar valuations and superior forecast earnings growth, there appears to be some support for EM small cap performance going forward.
That said, in the absence of an obvious timing opportunity, other factors should feature prominently in the decision to allocate to EM small cap.
Do active managers add value?
As it appears difficult to make a compelling case that now is a superior entry point for allocating to EM small cap strategies, a logical next step is to compare the ability to add value (excess returns) in the universe.
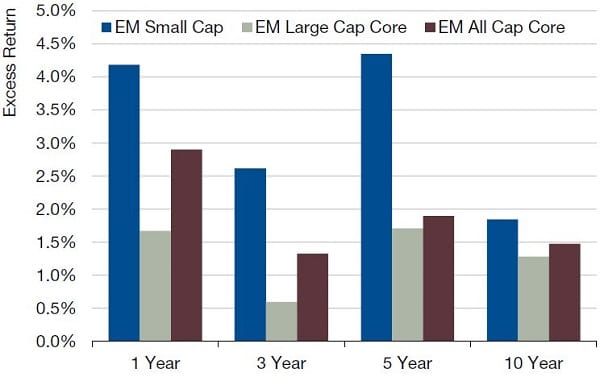
The analysis is based on data from the eVestment database for trailing 1, 3, 5 and 10 year returns of managers classified as EM large cap, all cap and small cap (Figure 4).
The median EM small cap manager outperformed its manager preferred benchmark by a wider margin than did managers in the other two groups.
This was especially true over the most recent five years when the median of EM small cap managers outperformed by 4.4 per cent compared to the 1.7 per cent and 1.9 per cent outcomes in the large cap and all cap universes, respectively.
While it might be difficult to make a case that now is a good time to allocate to EM small cap based on valuation, we believe there is a case to be made that excess return potential is more compelling in EM small cap.
Figure 4. Trailing Active Manager Median Excess Return as of 30 June 2016
Ori Ben-Akiva is head of international strategies at Man Numeric.


