Given that the yields on these securities are now negative, it is hard to believe that they can continue to drive global bond yields much lower.
Unless, for some reason, US Treasuries begin to narrow from current spread levels, it is hard to be too bullish on bonds.
However, I don’t believe that means we should necessarily be bond bears. Even if the great bond rally is drawing to a close, that doesn’t mean that it is now going to reverse violently.
It is more likely that we will see a period when bonds trade within a range, with any rally reversing fairly quickly and any sell-off likely to meet the same fate.
Potential causes of a bond sell-off
In my view, it is unlikely that a sell-off will emanate from US Treasury movements as it did in 2008.
JGBs and Bunds are more likely to be the catalyst for higher global bond yields, as they were in 2003 (JGBs) and 2014 (German Bunds).
Chart 1: 10-year JGB, Treasury and Bund yields
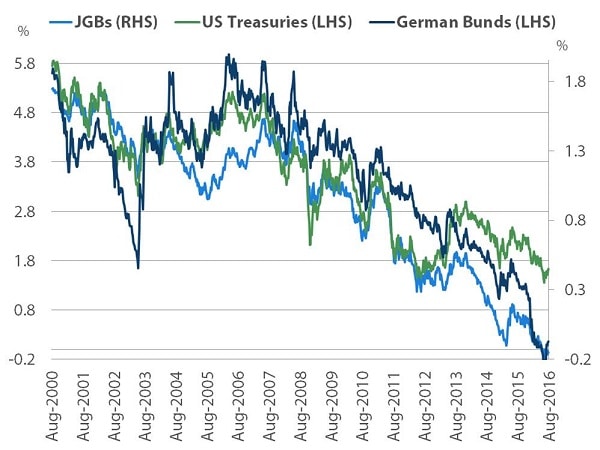
The 2013 ‘taper tantrum’ saw the sell-off in US Treasuries driving global bond yields.
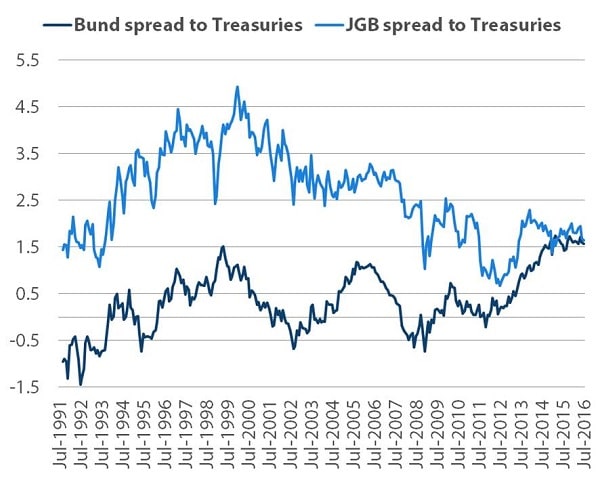
Since then, however, global bond markets (including the US) have been very much dominated by Bund and JGB movements, with their spreads to US Treasuries widening to their current level of around 1.6 per cent for both markets (see chart 2).
Chart 2: Spread of JGB and Bund yields to US Treasuries
This rally in Bunds and JGBs is being driven mainly by the quantitative easing programs of the European Central Bank (ECB) and the Bank of Japan (BoJ).
However, the performance of the bank sector in both those markets also helps to explain bond movements.
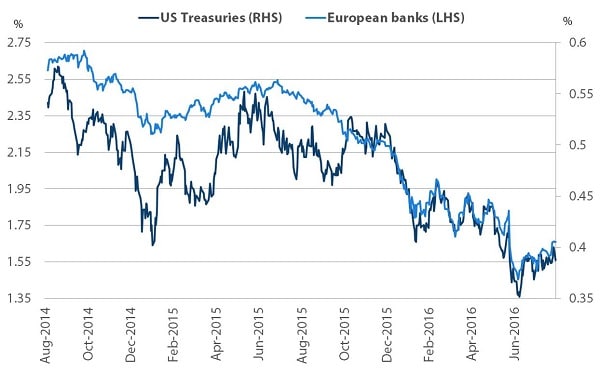
Chart 3 shows that US Treasury yields have been closely correlated to the performance of European banks, particularly in the past year.
Chart 3: Relationship between 10-year US Treasuries and European bank bond yields
In July, we saw a sell-off in JGBs due to market disappointment over the lack of a rate cut from the BoJ.
Since this meant that interest rates weren’t pushed any further into negative territory, Japanese banks outperformed, causing longer-dated JGBs to sell off.
This sell-off was largely contained within the Japanese market and didn’t have much effect on US Treasuries since they were still being supported by the underperformance of European banks.
US Treasuries currently look expensive
Ten-year US Treasuries currently appear quite expensive due to negative interest rates in Germany and Japan and the continuing underperformance of those countries’ banks.
What would be fair value for US 10-year rates? According to the Laubach-Williams model, an estimate for the current neutral level of the Fed funds rate is around 0.18 per cent.
Adding the Federal Reserve’s target of 2 per cent for inflation would give a fair value rate at around 2.2 per cent.
Interestingly, that is in line with the Federal Reserve Bank of New York model for the term 10-year structure of short-term interest rates.
Based on this, the NY Fed’s model sees the current term premium for US 10-year Treasuries at -0.6 per cent.
However, the historical average for the Fed’s favourite measure of inflation is only 1.7 per cent and not 2 per cent, which is not very different from the market’s current pricing for inflation in 5 years’ time at 1.68 per cent.
This back-of-the-envelope calculation puts an upper limit on the current fair value for US Treasuries at between 2 and 2.2 per cent, focusing only on the US and ignoring interest rates prevailing globally.
Bunds and JGBs will be the likely culprits in any sell-off
US rates have been fairly range-bound in recent weeks. Hedging costs have increased as a result of the recent rise in 3-month LIBOR for both Euro- and Yen-based investors, which in turn has reduced the hedged return on US 10-year Treasuries for foreign investors (see chart 4).
Chart 4: Return on US Treasuries from 3-month currency hedging for foreign investors
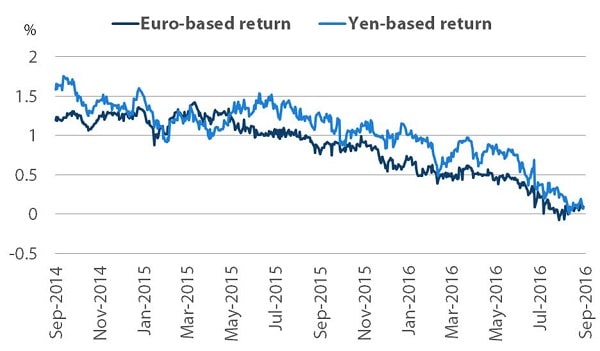
This has resulted from regulatory changes on money market funds which will be implemented in October and so the impact is likely to reverse unless the Fed starts raising interest rates.
The impact on the long end of the US Treasury curve has been minimal, which may suggest that a gradual interest rate tightening by the Federal Reserve may also have limited long-term impacts on that end of the curve.
Over the past three months, the JGB sell-off and the rise in LIBOR rates have had limited effects on US 10-year bond yields.
Since the Federal Reserve is likely to be slow in raising rates, this may indicate that Fed hikes will be tolerated and may in fact provide buying opportunities.
The real risk is that we see both Bunds and JGBs sell off together, reversing the reason for much of the recent bond rally.
The likely cause of such a sell-off would be a reversal of local bank underperformance, which could result from a change in European policy on how non-performing loans are handled or if Japan changes its policy on negative interest rates such that local banks will be less negatively affected.
Perhaps we have seen the end of the bond rally, but a severe reversal is unlikely, in my view. One potential strategic trade in the current environment could be to go long US Treasuries against either JGBs or Bunds.
If the market rallies, then it is likely that this will happen via a US spread narrowing.
A major sell-off is also likely to see spread narrowing as US Treasuries are probably closer to fair value than JGBs or Bunds, the major drivers of the bond market rally in recent years.
Roger Bridges is a global rates and currencies strategist at Nikko Asset Management.


