Not only do they need to decide exactly what proportion of assets to combine, they need to do so within the confines of the client’s risk tolerance and long-term goals.
Whether they’re designing their own portfolios or leveraging their institution’s portfolio strategy team, the question is the same: how to help maximise the client’s return without surpassing the client’s risk level.
One of the key concepts that accompanies this process is diversification. Diversification draws its roots from modern portfolio theory, a concept in finance that tries to maximise a portfolio’s expected return for a given level of risk (or minimise risk for the same level of return).
This is achieved by combining different asset classes that are not perfectly correlated.
Combinations of assets typically provide lower volatility than single assets because not all assets move in the same direction. The more these assets move in opposite directions, the lower the overall volatility of the portfolio.
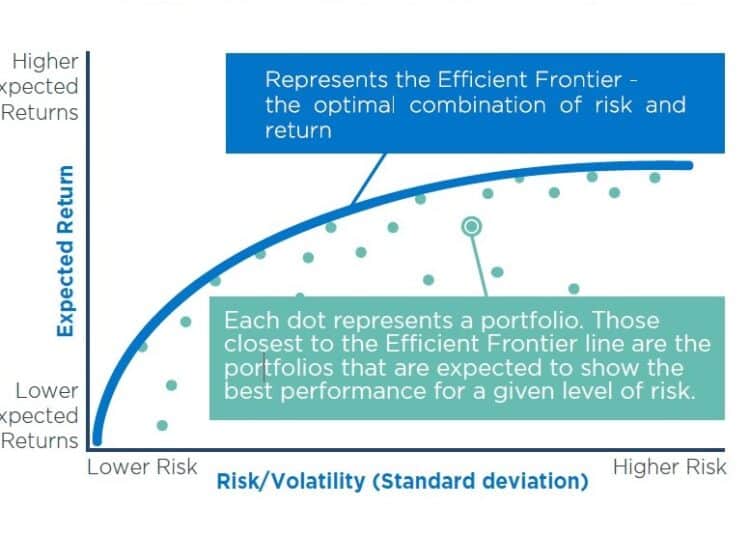
The optimal or most ‘efficient’ combination of assets falls along the efficient frontier. When most financial professionals think of the efficient frontier, the image below is what comes to mind:
* Source: Milliman Financial Risk Management LLC
Pioneered by Nobel Prize-winning economist Harry Markowitz in 1952, the ‘efficient frontier’ shows the best portfolio combinations that produce the greatest return for a given level of risk (measured as standard deviation).
Every potential blend of asset classes except risk-free assets is used and the optimal combinations plot the line.
In theory, if a client’s risk tolerance weren’t a factor, a client could choose any portfolio along the line plotted and receive the highest return for that specific level of risk.
The efficient frontier is curved because of the law of diminishing returns. Each unit of risk added to the portfolio adds slightly less return.
Based on that information, it would seem that all a financial adviser needs to do is calculate the efficient frontier and voilà, he or she can create the perfect set of portfolios for all clients at all risk levels.
The problem is the efficient frontier can change based on market conditions.
We will explain this by showing four different periods of time, each 10 years apart.
Starting in 1980, using just equities and fixed income, you would plot the efficient frontier as follows:
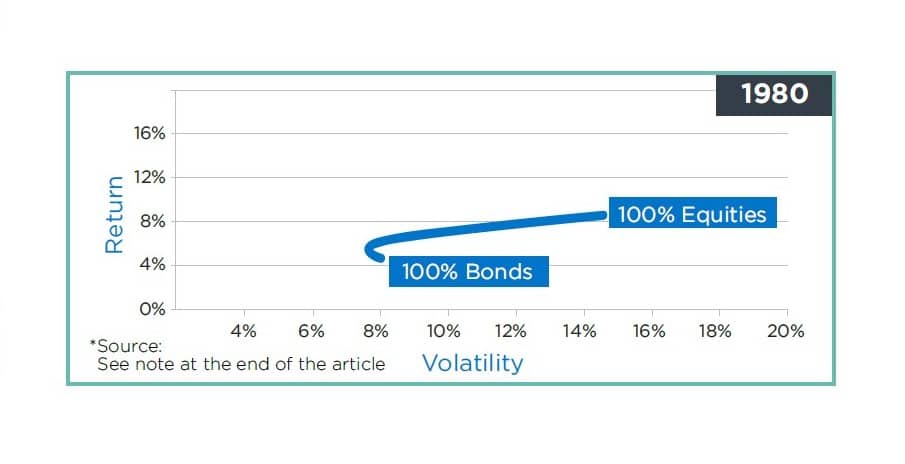
This image looks very similar to the original efficient frontier picture. Yet in 1990 the same equities and fixed income investments produce a very different picture:
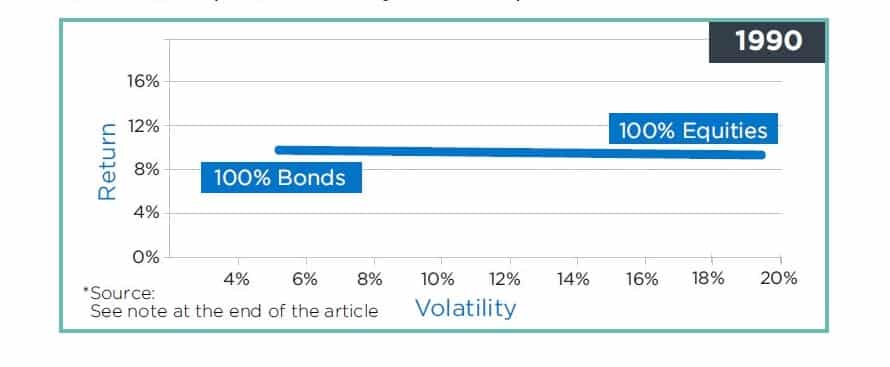
This changes again in 2000:
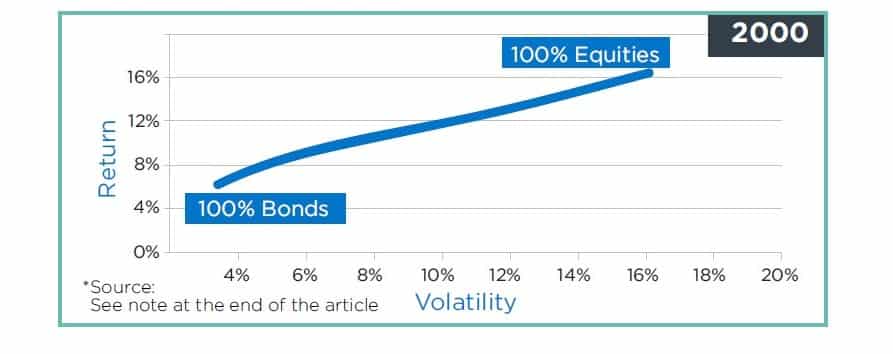
and 2010:
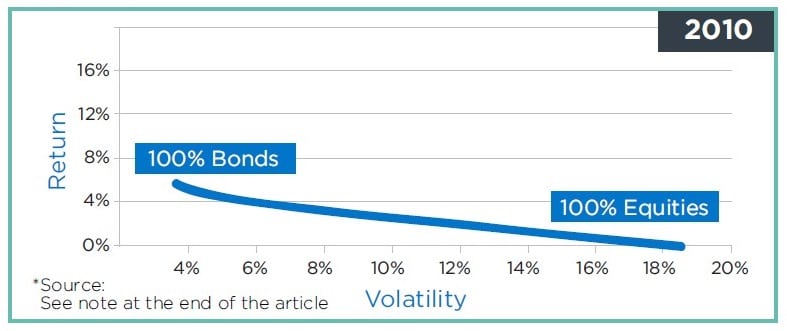
Four different time periods, four different efficient frontiers.
The reason for the difference is the changes in equity returns and fixed-income yields over time.
For example, in 2010 the compound annual growth rate for the S&P 500 with dividends reinvested for the preceding 10 years was 1.4 per cent. Just 10 years earlier, in 2000, it was 17.4 per cent.
Interest rates also had a huge effect on that calculus. Although interest rates change over each decade, if you looked only at average 10-year US Treasury interest rates in 1980, 1990, 2000, and 2010, they were 11.5 per cent, 8.6 per cent, 6.0 per cent and 3.2 per cent.
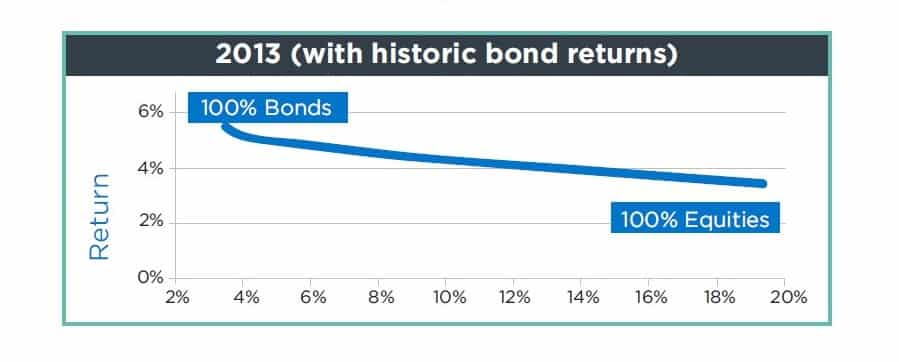
As with any mathematical model, the assumptions and inputs into the model greatly affect the outcome. For example, if you applied the efficient frontier in 2013 using historic interest rates, the efficient frontier becomes inverted:
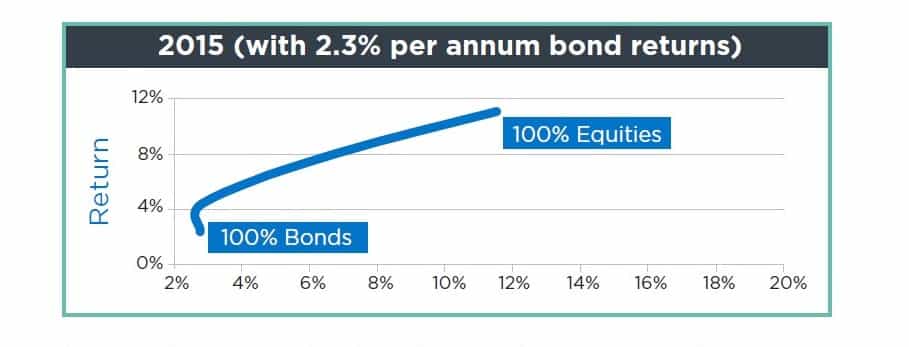
As of 30 September 2015, the annualised equity return for the prior five years was 11 per cent and for bonds it was 3.1 per cent, a flip flop from the 2013 period illustrated above.
The 10-year bond yield is currently 2.3 per cent, which is much closer to the historic return than it was in 2013.
As an adviser, you should ask yourself: how often do I change my clients’ asset allocation?
Is it the same 60/40 split to which balanced clients have been exposed for years, or is your process of updating portfolio weightings more robust?
The efficient frontier is an excellent theoretical model as it tries to achieve the difficult goal of finding the perfect portfolio at any risk level.
Of course, as new information comes in and markets change, you need a portfolio rebalancing strategy.
David Itzkovits is the head of investments at Sanlam Global Investment Solutions.
* Equities are based on an investment in the S&P500 index and bonds are based on an investment in the Barclays Capital Aggregate US Bond Index. Returns and volatilities are calculated over the preceding 10-year period using monthly data. Past performance is no indicator of future performance.


