There are a number of different recession indicators that have historically been used to signal a recession in the US. None of these indicators have a perfect track record, but if a majority of these indicators are in danger territory, we should pay attention. Thus, we have looked at nine different indicators that have historically been used to “predict” recessions in the US:
• The yield spread between 10-year and 2-year treasuries. If it is negative, we count it as an indicator that signals a recession in the next 12 months.
• The Federal Reserve is cutting interest rates. If this is the case, we count it as an indicator that signals a recession in the next 12 months.
• The ISM Manufacturing Index. If it drops below 50 points, we count it as an indicator that signals a recession in the next 12 months.
• Quarterly GDP growth. If we get one quarter of negative growth, we count it as an indicator that signals a recession in the next 12 months.
• Nonfarm payrolls. If the average number of new jobs over the last three months is below the average number of the previous three months, we consider it a recession signal. The three-month averages are used to smooth out any outliers that may appear in any given month.
• Existing and new home sales. If the three-month average is below the average of the previous three months, we consider it a recession signal.
• The recession probability for the next 12 months calculated by the New York Fed and the Cleveland Fed based on two different methodologies. If the recession probability rises above 30 per cent, we consider it a recession signal. The level of 30 per cent is used, because historically, almost every time these indicators climbed above 30 per cent they continued towards 50 per cent and a recession followed. However, in some cases (e.g. the recession of 2001) these indicators never even reached 50 per cent probability.
Figure 1 shows how many of these indicators signalled a recession in the US in the next 12 months together with the official US recession dates (grey areas). Even though we use nine different recession indicators they were never triggered all at the same time. Recessions typically happened when five or six of these indicators signalled a recession. Even during the 2008 global financial crisis, the biggest crisis in more than seven decades, only six out of these nine indicators signalled a recession.
Figure 1: Number of indicators signalling a recession in the US
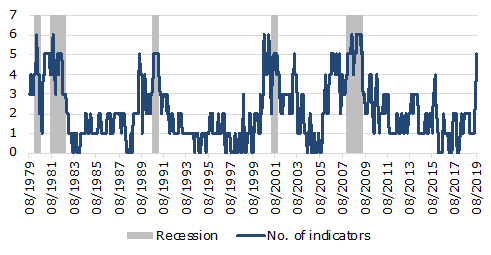
Source: St Louis Fed, Whitehelm. Data as at 15 August 2019.
With the global trade war leading to lower growth in the US as well as China and countries that depend on Chinese demand like South Korea, Taiwan and Germany, slowing global demand is one of the drivers of the current slowdown. But in the US, the housing market is also slowing down since the Federal Reserve has hiked interest rates for the last four years and thus made mortgages more expensive.
With the global economy slowing down, the challenge for policymakers will be to find the right means to avert a recession. Since central banks in developed countries lowered monetary policy rates close to zero and in some instances even below zero, conventional monetary policy is not able to provide much support this time around.
Thus, there is an increasing number of economists and politicians who argue in favour of fiscal stimulus to avert a potential recession. This fiscal stimulus can take on many different forms, but increased infrastructure spending seems to be among the most likely outcomes of these calls for fiscal stimulus. The reasons why increased infrastructure spending seems likely in the coming years are manifold.
First, there is a massive need for infrastructure spending in developed countries due to years of austerity and cost cutting on maintenance and new developments. McKinsey estimates that global infrastructure investment needs amount to $49.1 trillion until 2030.
Second, infrastructure spending is politically feasible. Even in today’s world of extreme political polarisation and rising populism, infrastructure spending is something most politicians can get behind. Furthermore, economists have calculated that infrastructure spending is one of the most effective means of strengthening the economy. The so-called fiscal multiplier of infrastructure spending is well above one, meaning that every dollar spent on public infrastructure projects leads to more than one dollar of increased GDP. Compared to the flash in the pan that is created by cutting taxes, fiscal deficits due to increased infrastructure spending seems like money well-spent.
Finally, the realisation that economies need to reduce their reliance on fossil fuels to reduce the harmful effects of climate change mean that there is a significant need to spend on renewable energy and the infrastructure needed to support it (e.g. utility-scale batteries and smart grids). Today, large-scale government spending projects like the Green New Deal are at least being debated in the US, while the UK and other European countries have committed themselves to generate at least 50 per cent of electricity from renewable sources by 2050. Even the famously frugal Germans are debating a temporary abandonment of their policy not to have government deficits in order to fight the potential of a recession and modernise its infrastructure.
Industry challenges for non-core infrastructure
Non-core infrastructure companies are likely to face industry-specific headwinds in the next few years. While regulated infrastructure benefits from stable cash flows even in times of an economic slowdown due to their quasi-monopolies and their long-term contracts with government regulators, non-core companies don’t have such long-term contracts. In fact, their operating profits often face margin compression as demand for their products and services declines in a slowing economy and thus these companies are forced to compete with lower prices.
Furthermore, non-core infrastructure companies are unlikely to benefit to a large degree from public infrastructure spending since government spending on infrastructure is usually focused on vital infrastructure like roads, electricity grids and the like and does not extend to regulating prices for power generation or retail electricity trade.
Conclusions
The global economy is slowing down and this means that businesses operating in unregulated markets, such as non-core infrastructure companies are likely to face declining profit margins and declining stock prices. In contrast, regulated core infrastructure investments are shielded from these developments and should hold up considerably better in a slowing economy. Furthermore, there are increasing calls to increase infrastructure spending in times of a recession. After all, many western central banks don’t have the means to fight a recession by cutting interest rates, so more of the heavy lifting must be done by politicians engaging in fiscal stimulus. And infrastructure spending is one of the few remaining common grounds for politicians of all parties.
Ursula Tonkin is head of listed strategies at Whitehelm Capital.


